thermal transitions in dsc
Theoretical analysis of TGA, DTA and DSC plots for decomposition steps and thermal transitions practical in Hindi for BSc chemistry students including aim, theory, procedure, observation, calculation and result.
Practical Title
Theoretical Analysis of TGA, DTA, and DSC Plots for Decomposition Steps and Thermal Transitions
1. उद्देश्य (Aim)
TGA, DTA और DSC तकनीकों के प्लॉट्स का अध्ययन करके thermal decomposition steps और thermal transitions (जैसे melting, crystallization, glass transition) का theoretical analysis करना।
2. सिद्धांत (Theory)
Thermal analysis वह तकनीक है जिसमें किसी पदार्थ के temperature के साथ होने वाले परिवर्तन को मापा जाता है।
तीन मुख्य तकनीकें हैं:
1. TGA (Thermogravimetric Analysis)
इसमें तापमान बढ़ाने पर sample के mass (weight) में होने वाले परिवर्तन को मापा जाता है।
मुख्य उपयोग:
- Decomposition study
- Moisture content determination
- Thermal stability
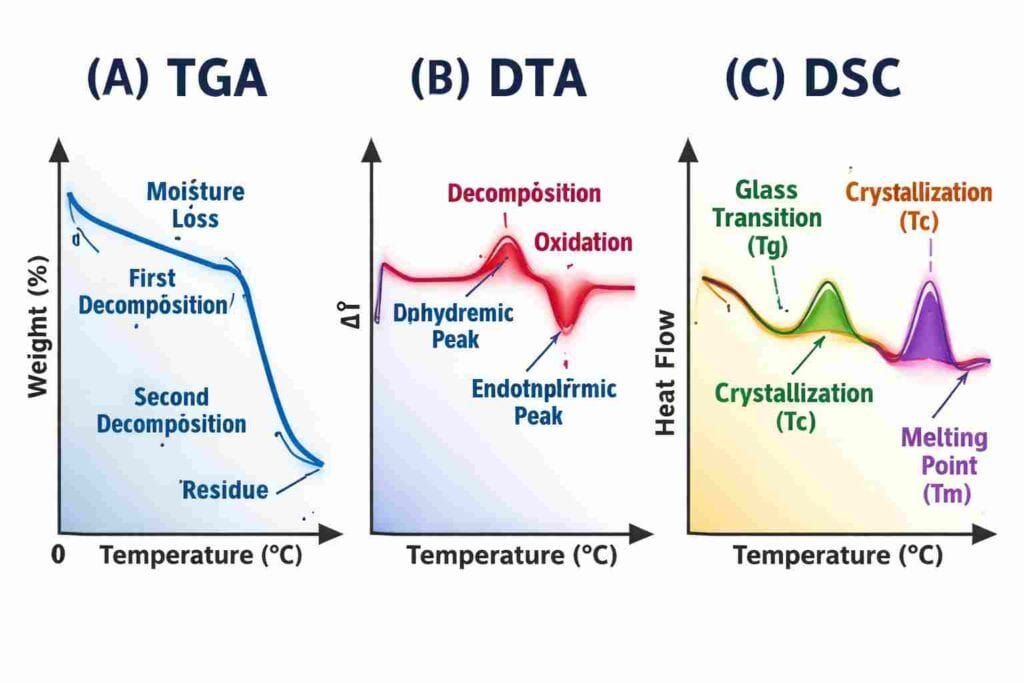
TGA graph:
- X-axis → Temperature
- Y-axis → Weight (%)
जब sample decomposition करता है तो weight decrease होता है।
2. DTA (Differential Thermal Analysis)
इस तकनीक में sample और reference material के बीच temperature difference को मापा जाता है।
DTA graph:
- X-axis → Temperature
- Y-axis → Temperature difference (ΔT)
Peaks के प्रकार:
- Endothermic peak: Heat absorb होती है (melting, dehydration)
- Exothermic peak: Heat release होती है (crystallization, oxidation)
3. DSC (Differential Scanning Calorimetry)
इसमें sample द्वारा heat flow को मापा जाता है।
DSC graph:
- X-axis → Temperature
- Y-axis → Heat flow
Thermal transitions:
- Glass transition (Tg)
- Melting point (Tm)
- Crystallization (Tc)
3. आवश्यक उपकरण (Apparatus)
- TGA instrument
- DTA instrument
- DSC instrument
- Sample holder
- Furnace
- Computer for recording plots
4. प्रक्रिया (Procedure)
- Sample को sample holder में रखें।
- Instrument को nitrogen या inert atmosphere में चलाएँ।
- Temperature program set करें (जैसे 10°C/min heating rate)।
- Temperature gradually increase करें।
- Computer system TGA, DTA और DSC plots record करता है।
- प्राप्त plots से decomposition steps और thermal transitions का analysis करें।
5. प्रेक्षण (Observation)
(A) TGA Plot Analysis
| Temperature (°C) | Weight (%) | Observation |
|---|---|---|
| 30 | 100 | Initial mass |
| 120 | 95 | Moisture loss |
| 300 | 70 | First decomposition |
| 500 | 40 | Second decomposition |
| 700 | 20 | Residue formation |
(B) DTA Plot Observation
| Temperature (°C) | Peak Type | Interpretation |
|---|---|---|
| 110 | Endothermic | Dehydration |
| 320 | Exothermic | Decomposition |
| 520 | Exothermic | Oxidation |
(C) DSC Plot Observation
| Temperature (°C) | Transition |
|---|---|
| 80 | Glass transition |
| 150 | Crystallization |
| 250 | Melting point |
6. गणना / Analysis (Calculation)
Decomposition Percentage
Weight Loss=Initial Weight−Final Weight
Example:100−70=30%
इसका अर्थ है कि 30% sample decomposition हुआ।
7. परिणाम (Result)
TGA plot से sample के mass loss steps ज्ञात हुए।
DTA plot से endothermic और exothermic transitions का पता चला।
DSC plot से glass transition, crystallization और melting temperature की पहचान हुई।
इस प्रकार thermal analysis techniques द्वारा sample की thermal stability और decomposition behavior का अध्ययन किया गया।
8. सावधानियाँ (Precautions)
- Sample की मात्रा बहुत अधिक न लें।
- Instrument को calibration के बाद उपयोग करें।
- Temperature program सही सेट करें।
- Data recording सावधानी से करें।